***** Panelist Performance - Individual Reps Feedback Report *****
Purpose
-------
The Panelist Performance Individual Reps Feedback Report report allows for a detailed review
of consistancy over reps for each panelist performance by calculating the standard deviation of
responses to attributes for each rep of each sample by each of the panelists.
Two Rep Tests are required for this report.
Attributes
----------
Attributes types included on the report are Line Scales, Hedonics, and Grouped Intensity.
Raw Test Data
-------------
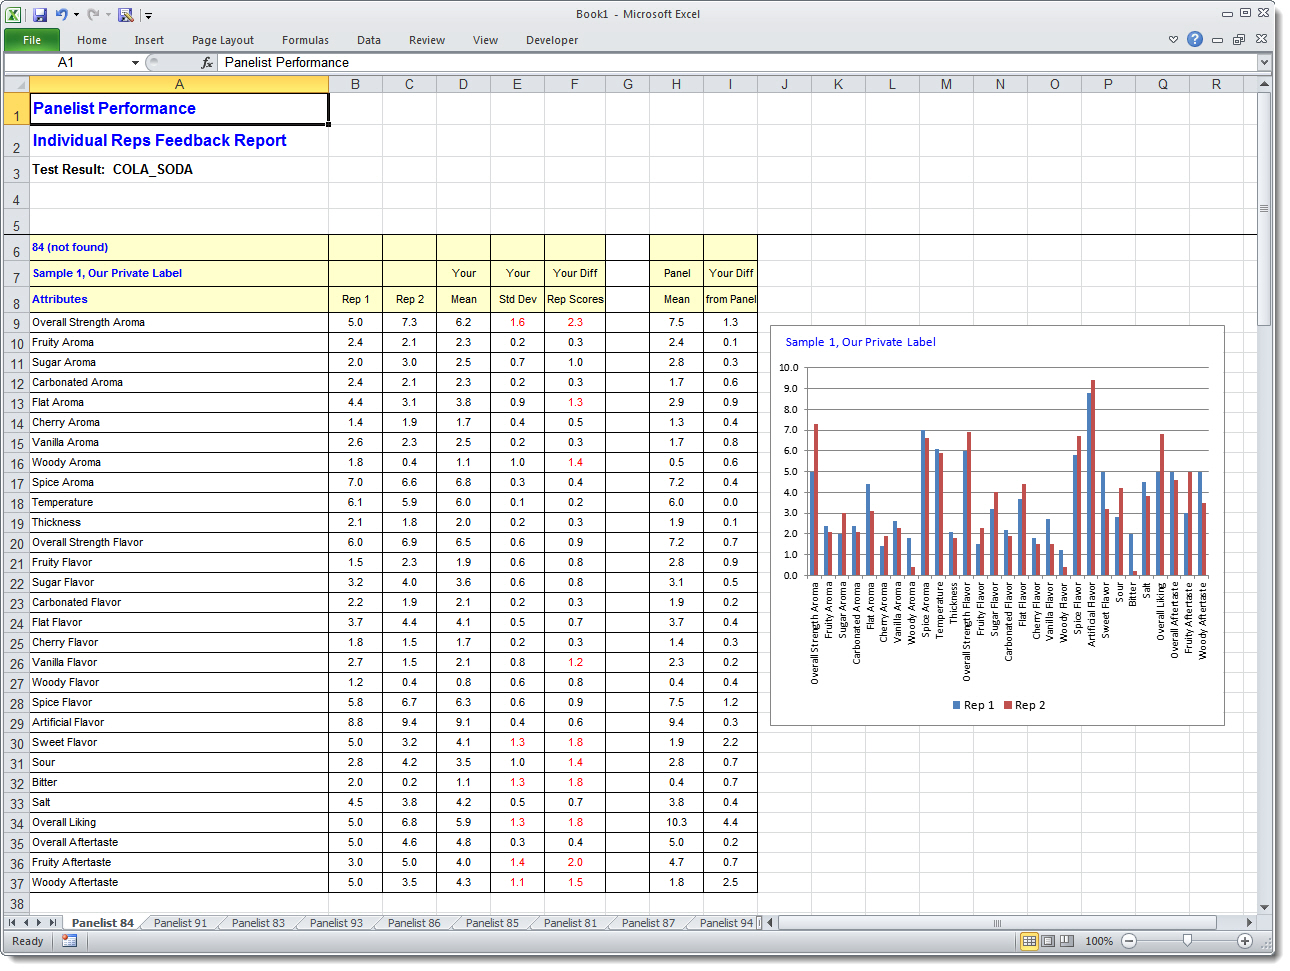
Panelist's Raw Test Data scores for each sample and rep is listed on one worksheet tab per panelist.
Attribute descriptions are listed by rows.
Rep Scores, Panelist Mean, Panelist Std Dev, and Difference in Rep Scores are listed by columns.
Standard Deviation
------------------
Standard Deviation are calulated using Excel Function STDEV()
Interpretation:
Lower standard deviation values are preferable which indicate lower variation of data responses.
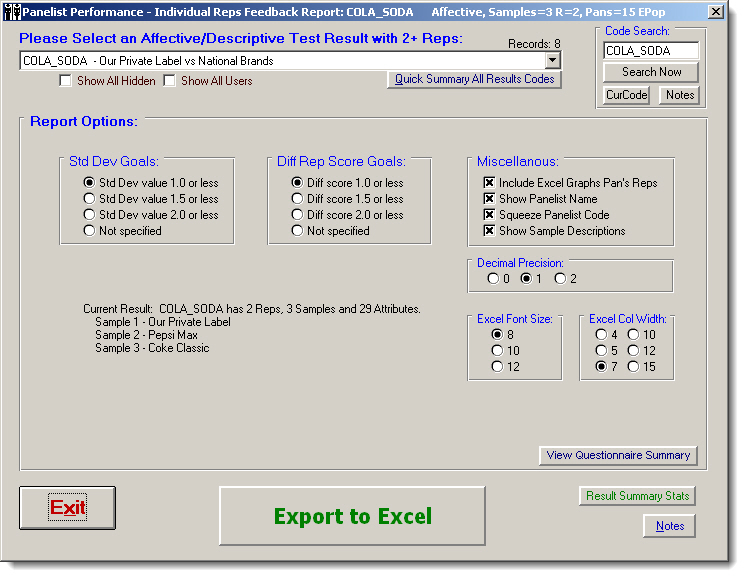
Std Dev Goals
-------------
Allows for optional RED numerics in Excel cell when Panelist Reps Std Dev value is not 1.0/1.5/2.0 or less.
The frequency counts will be summerized on bottom of each Excel worksheet for each panelist.
Diff Rep Score Goals
--------------------
Allows for optional RED numerics in Excel cell when Panelist Reps Scores difference absolute value is not 1.0/1.5/2.0 or less.
The frequency counts will be summerized on bottom of each Excel worksheet for each panelist.
Show Panelist Name
--------------------
Allows for optional showing of the panelist name on report, otherwise only the panelist code will be displayed.
Squeeze Panelist Code
---------------------
Allows for optional squeezing of the panelist code, example 0000001234 will be squeezed to 1234.
Include Excel Graphs Pan's Reps
-------------------------------
Generate cool graphs, 1 for each panelist and each sample, showing Reps scores for each rep columns.
Excel Worksheet Tabs
--------------------
The report will create Excel Worksheet Tabs for every Panelist.
|

 HOME
HOME

 VIEW REPORTS