 HOME
HOME CONTACT
 SUPPORT
 SENSORYTEST.COM
 |
 HOME HOME CONTACT CONTACT SUPPORT SUPPORT SENSORYTEST.COM SENSORYTEST.COM |
|
Sensory testing professional's favorite virtual desktop. Say hello to SIMS Cloud Systems. From any device, any laptop, any iPad and even your cell phone. Log in from anywhere anytime. Inquire today. 
|
Mobile devices real test example Point your cell phone camera Easy for your respondents 
Link |
 VIEW REPORTS
 |
 QUESTION CHOICES
 |
 TEST CHOICES
 |
| Ranking Sample Preference Examples | View More Question Type Choices |
|
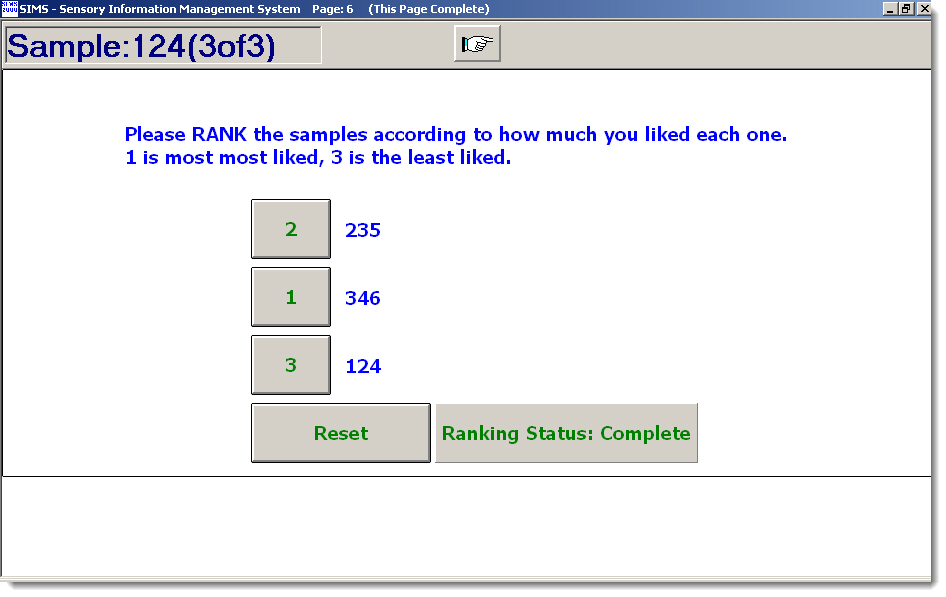
Ranking Sample Preference Examples Panelist Ballot 
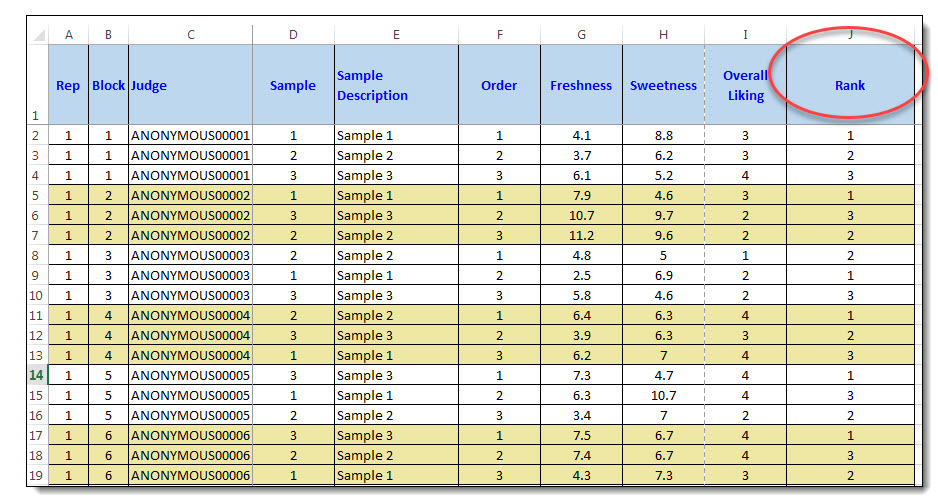
Ranking Reporting - Raw Data Excel Each raw data excel row shows all responses for one individual sample. The Rank column is the rank for the Sample shown in Excel column D & E. 
Ranking Reporting - Statistical Analysis 

Ranking Reporting - Frequency Reports
-------------------------------------
  Review the SIMS Frequency reports to see how many times (frequency) each sample scored 1st, 2nd, 3rd, and so forth, and the MEAN scores.
  The Mean scores comparisons should give you the overall RANK preference.

  Here how to get the % and/or # of people who preferred sample 1, 2, 3, etc.

     SIMS Frequency Report    Select option sort -->  By Attribute - Samples Appear in a Table Format

        Result Code: SCS-EXAMP3 - Example Affective Linescales and Ranking

            Attribute Type: Ranking Scale   Description:  Rank

                                            Sample 1     Sample 2     Sample 3
                                            -----------  -----------  -----------
            Rank 1                           4 (44.4%)    2 (22.2%)    3 (33.3%)
            Rank 2                           2 (22.2%)    6 (66.7%)    1 (11.1%)
            Rank 3                           3 (33.3%)    1 (11.1%)    5 (55.6%)

            Mean                                 1.889        1.889        2.222
                                                 (n=9)        (n=9)        (n=9)


Ranking Reporting - Raw Data Excel
----------------------------------
     Rank column shows the actual rank value as shown.
     Each raw data excel row shows all responses for one individual sample.  The Rank column is the rank for the Sample shown in Excel column D & E.


Ranking Reporting - Ranking Attribute Statistical Analysis
----------------------------------------------------------

     For Complete Blocks:
         The Test Design, and Data collected, should naturally be perfectly BALANCED per Ranking, aka Balanced Complete Block.

         For Ranking Analysis SIMS generates a nonparametric analysis using the Friedman statistic,
         also called the Friedman Rank Sum Test, International Standard ISO 8587, by economist Milton Friedman,
         and is defined as follows:

             Friedman Statistic T = ( ( 12 / bt(t+1) ) * (R) ) - 3b(t+1)
                                 (Reference:  Sensory Evaluation Techniques, 3rd Ed, 13.14 & 13.15, pg 292)

             where b = Number of Panelists
                   t = Number of Samples Presented to Each Panelist
             and (R) = sum of squared rank sums

         The Friedman statistic is typically applicable for complete block experimental designs only.

             Alternate Reference:  Sensory Discrimination Tests and Measurements, Jian Bi, 5.2.1, pg 82.
                Friedman Statistic F = ( (12 / bt(t+1) ) * E [ R - n(t + 1) / 2 ]^2
                       This Formula returns same value result for T as shown above.


     For Incomplete Blocks:
         The Test Design, and Data set collected, should usually be BALANCED, aka Balanced Incomplete Block (BIB).

         If your data is Unbalanced Data Set (UBIB), SIMS SAS/R/JMP/Excel p-value calculations will still occur,
             but applicability is debatable and best stats should be evaluated on a case-by-case basis.
             Best when high N(the #panelists) and the degree of incomplete blocks is low, ie. 5C4 is good, 20C4 less so.


         Durbin Statistic D = [ 12(t-1) / rt(k^2-1) ] E (R(j) - r(k+1)/2)^2
                              (Reference:  Jian Bi, 5.2.5, pg 86)

         P-Values:  Like Complete Block Tests, Chi-Square Distribution functions are utilized.
                    If n is low, the Skillings and Mack (1981) Table 2 approximations may be utilized.

         The LSD calcs below are modified accordingly in the SqR() math
             LSD = Fisher's Least Significant Difference.
               (Reference:  Sensory Evaluation Techniques, 3rd Ed, 13.19, pg 295)
|
|
(The Scales on this Web page are not interactive.) |
