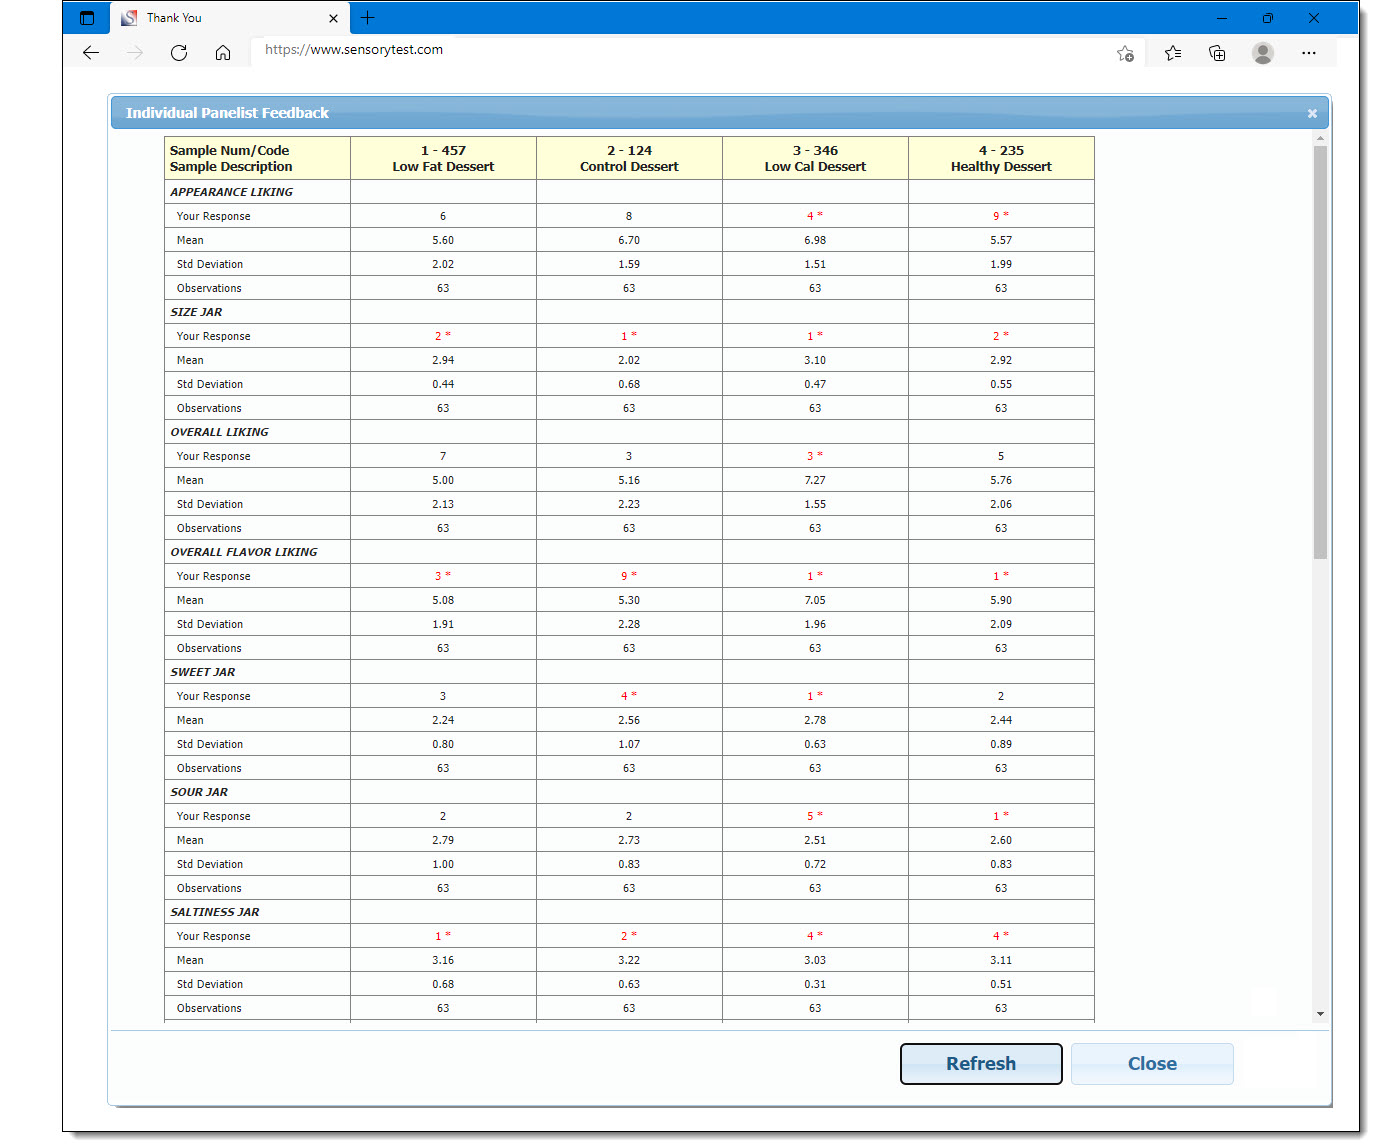
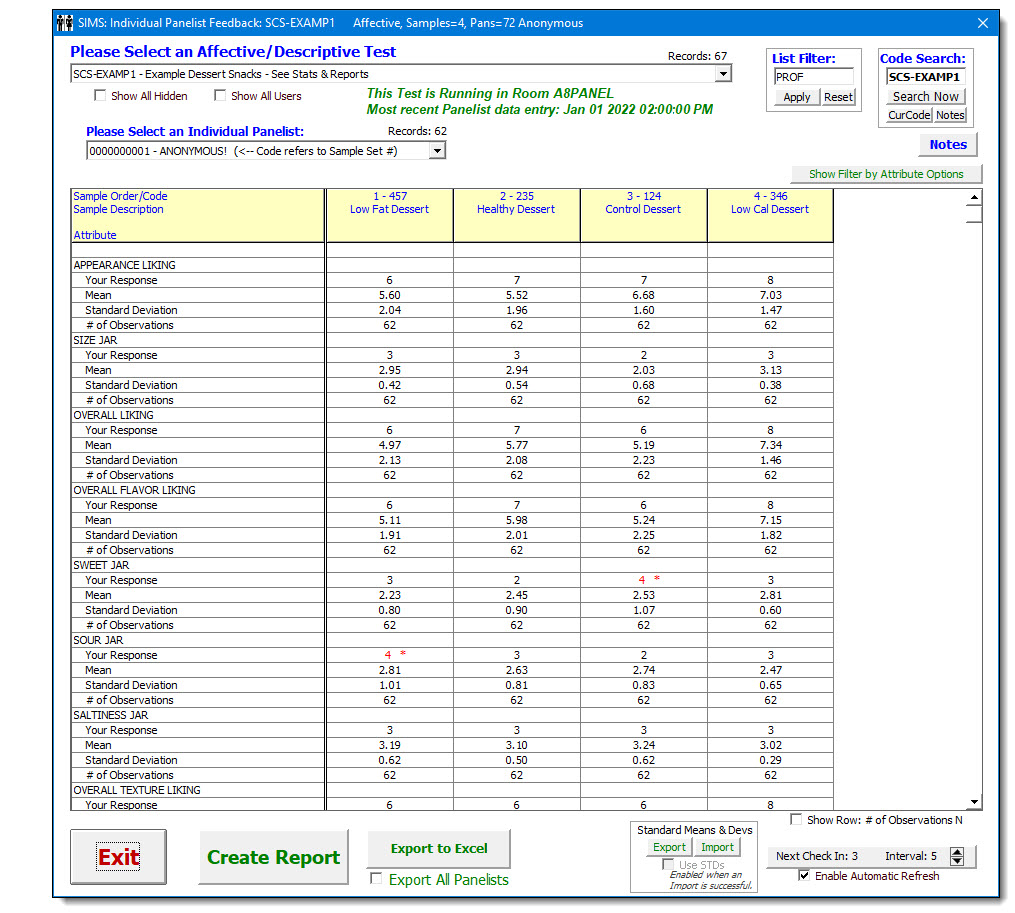
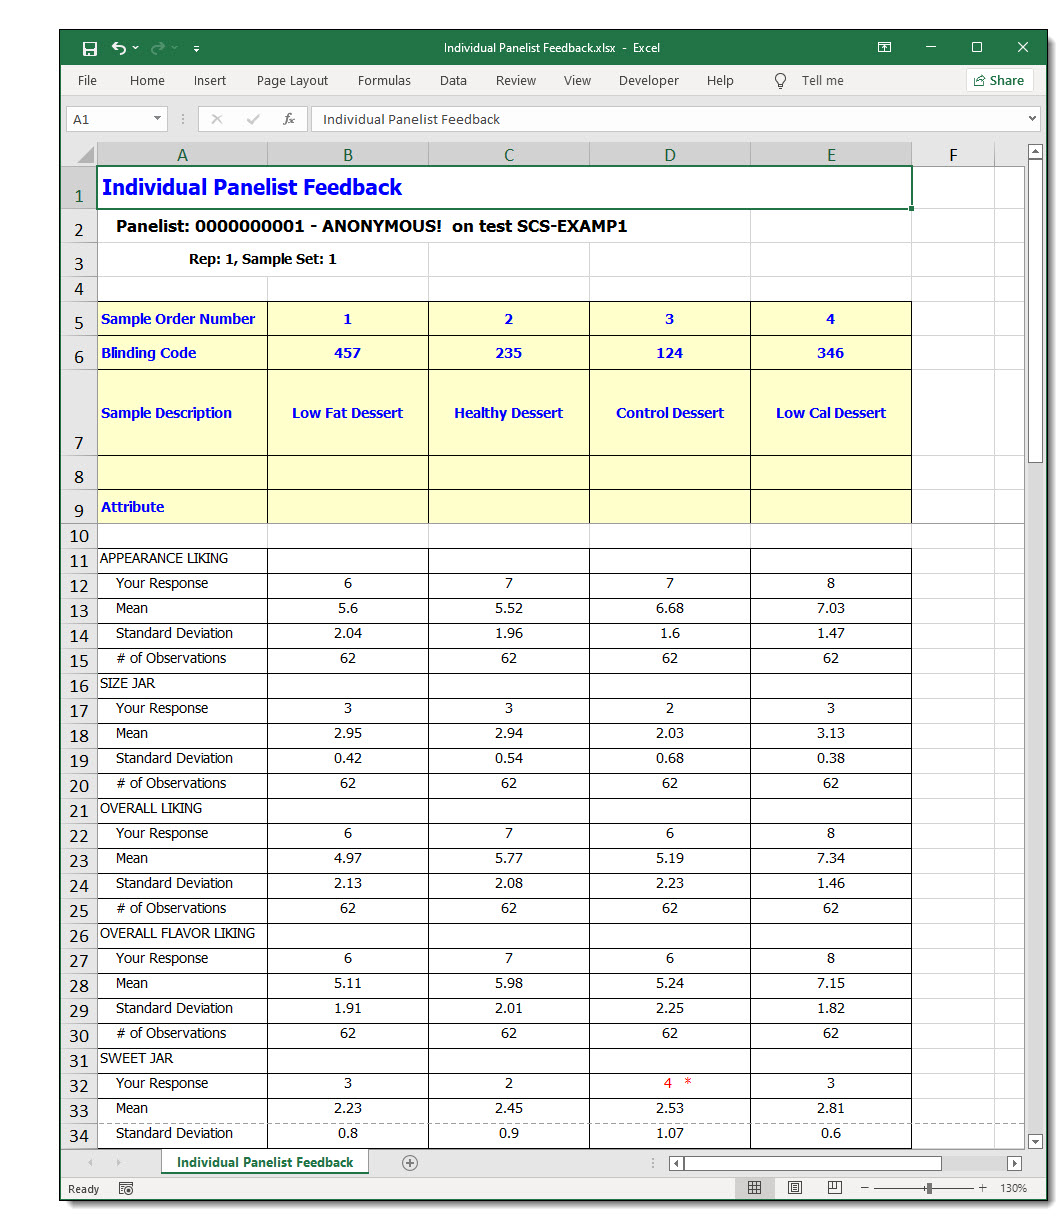
             ***  Panelist Feedback  -  Report Notes  ***


 The Panelist Feedback Report enables panelists to see how their numeric
 responses compare to other panelists completing the same sensory test.

 The report identifies each sample and associated blinding code presented to the
 panelist in the sample presentation order.  For each attribute and sample
 combination the report includes the following values:

        Response      Panelist numeric response, the current panelist only.

        Mean          Average of all panelist responses to that attribute and sample

        Standard      The computed Standard Deviation (a measure of dispersion)
        Deviation     of all panelist responses to that attribute and sample

        # of          Count of all panelist responses to that attribute and sample
        Observations  This row optionally can be hidden from the report.

  Multiple Replications (reps)
   If a sensory test design has samples in more than one replication, additional on screen options will be available.
   - Please Select a Rep Number.   Select your desired rep, or select 'Average' to have all reps combined and averaged.
   - Average label, when reps 'Average' is selected, optionally change the text indication on the reports, default is '(Avg)'


 Attribute Types
 ===============

   Attribute types included in the report are the following:
        Line Scale, Hedonic, Yes/No, Magnitude Estimation,  Grouped Intensity


 Sample Columns
 ==============

   The Sample Columns are ordered from left to right according to the order in
   which they are presented to the individual panelist.

   Note:  The Sample Description shown in the report is the 'Description User Sees
   During Test' if such a description exists in the Experimental Design associated
   with the Result Test Definition.  Otherwise, the Sample Description is the
   'Internal Sample Description.'

   Multi Rep Tests, Panelist only see their current active Replication.
     Technicians typically view reps individually.  Averaging Reps is an option,
     and when selected, report rows for response, means, etc. will use all reps to
     calculate grid values.  Sample Columns are ordered from left to right by
     absolute sample numbers, not the presentation order which usally varies accross reps.

   The attributes are always shown in order of presentation from top to bottom.


 Report Format
 =============

   If a panelist response is different from the mean by more than one Standard
   Deviation, that response will appear in the color RED and it will be followed by
   an asterisk(*).  If the difference between the response and mean is more than
   two times the Standard Deviation, the response will be followed by two asterisks.

   The report should provide enough room to display 3 or 4 sample columns easily.
   However, you can increase or decrease the width of each column by using your
   mouse to drag the column dividers left or right.

   As you scroll down the report, the BLUE area with the sample identification
   information continues to display at the top.  If you scroll the samples left and
   right, the attribute information always appears in the leftmost column.


 Refreshing/Updating Report Information
 ======================================

   A test is 'Active' when one or more panelists are signed-in and are working to
   complete their sessions.  By default, SIMS will automatically refresh each
   report every 30 seconds.  You can increase or decrease the time between report
   updates by clicking the Up or Down Arrows to increase or decrease the Interval
   shown in the lower right hand corner of the report form.

   A Test will also be considered 'Active' and allow for Refreshing/Updating,
   whenever a sensory technician is viewing this report, and an observation
   has been recorded on the test within the last 60 minutes.  This allows for
   viewing observations even when panelists Take Test at This Station.

   Additionally, you can stop refresh completely by clearing the check from the
   'Enable Automatic Refresh' box.  If you want to update the report immediately,
   click the words 'Next Check in' when the 'Enable Automatic Refresh' box is marked.

   If you are viewing the report as a sensory technician for an Active test, you
   can also refresh the report by clicking the 'Create Report' button.


 Report Options
 ==============

   In order to create this report, the procedure is as follows:

     1. Select a Test Result.
     2. Select an individual panelist among those who have responded to one or more test attributes.
     3. If test data exists for more than one Replication, you will see a combo box to select a single rep.
     4. Click 'Create Report.'
     5. Once the report is visible, you can click 'Export to Excel'
        to create an Excel spreadsheet file to share with others or to print for the panelist.


 Report Content
 ==============

   The content of the report differs somewhat depending on whether it is being
   viewed by the panelist or the sensory technician.  The panelist will see
   information on the mean and standard deviation only for those attributes and
   samples to which he/she has responded.  The technician will see the mean and
   standard deviation for attributes and samples to which ANY panelist has  responded.


 Option:  Standard Means & Devs    (Standard Means And Standard Deviations)
 ===========================================================================

   Allows technician to SWAP in external values for Standard Means and Standard Deviations.
   This is only available for technician reporting, and is not supported for live testing panelist feedback,
   in which case the means and deviations will be the true calculated values from the live test participants.

   Excel:  Use Excel Export and Import to create your Attribute standards.
     Import via Windows Copy-n-Paste of the spreadsheet's significient cell block, usually the white background cells.
     Recommendation:  SAVE your Excel files containing Attribute Standards for future use.
     The Excel file's attributes are matched to the test's attributes by the actual text wording in Excel Col A.
       If no attribute match is found, the attribute mean and dev will remain the true calculated values from the live test.
     The Excel file's absolute samples #'s are in Excel Cols B, C, D, etc.  These are absolute samples 1, 2, 3, etc.,
       and are matched to the test's absolute samples.
       WHILE THE SAMPLE ORDER THAT IS SHOWN on the SIMS Report may be a different order for each panelist, this order may not be the same absolute sample orders in your Excel.
       Its totally ok, just be aware when you [import] multiple sample columns from Excel, eventhough it may not be the same order left to right, the data is indeed landing prnoperly.
     Values which are non-numeric, such as blanks, or Null, or text, will be ignored,
       and the attribute mean and dev will remain the true calculated values from the live test.

   Recommendation:  Verify your reports for accuracy and successful use of your Standard Means And Standard Deviations.


 Selecting When Individual Feedback is Displayed to the Panelist
 ===============================================================

      The Panelist Individual Feedback feature is intended to be used to train
      panelists in refining their responses to sensory stimuli.  It will most likely
      be used where panelists can discuss their responses with a sensory technician
      and perhaps with each other.

      Panelist Feedback will NEVER be displayed when Test Result data is NOT saved.

      Check the box 'Provide Panelist Feedback (Affective/Descriptive Only)' to show
      this report to panelists taking the test.  There are three options as to WHEN
      the report will appear:

          End of Test (Default)
          End of Sample
          Next Page

      These options refer to when the panelist clicks the corresponding button.  If
      the test allows a panelist to exit the test on any sample, or forces the
      panelist to exit the test after responding to x samples, the report will appear
      even if the panelist has not completed all samples in the test.

      Selecting 'Next Page' will also cause the report to appear when the panelist
      clicks on 'Next Sample' or 'End Test.'

      Similarly, selecting 'End of Sample' will also make the report appear when
      panelist clicks 'End Test.'

      If a test is bidirectional, the report will never appear when the panelist
      clicks the 'Previous Page' button.

      We recommend that you use the 'Test at This Station' to get an understanding of
      the extent to which the Panelist Feedback Report affects the continuity of the
      testing process, as well as the ability of the panelist to focus on the
      information presented.
|

 HOME
HOME CONTACT
 SUPPORT
 SENSORYTEST.COM
 HOME
HOME CONTACT
 SUPPORT
 SENSORYTEST.COM

 VIEW REPORTS
  QUESTION CHOICES
  TEST CHOICES