
 HOME
HOME CONTACT
 SUPPORT
 SENSORYTEST.COM
 |
 HOME HOME CONTACT CONTACT SUPPORT SUPPORT SENSORYTEST.COM SENSORYTEST.COM |
|
Sensory testing professional's favorite virtual desktop. Say hello to SIMS Cloud Systems. From any device, any laptop, any iPad and even your cell phone. Log in from anywhere anytime. Inquire today. 
|
Mobile devices real test example Point your cell phone camera Easy for your respondents 
Link |
 VIEW REPORTS
 |
 QUESTION CHOICES
 |
 TEST CHOICES
 |
View More Question Type Choices |
| TIME TDS TEMPORAL DOMINANCE OF SENSATIONS
This webpage shows Time TDS Temporal Dominance of Sensations. Also see Time Delay Also see Time Interval Intensity Also see Time Intensity Continuous Also see Time TDS Temporal Dominance of Sensations Also see Time Counter Seconds
TDS Temporal Dominance of Sensations - Questionnaire & Report Examples 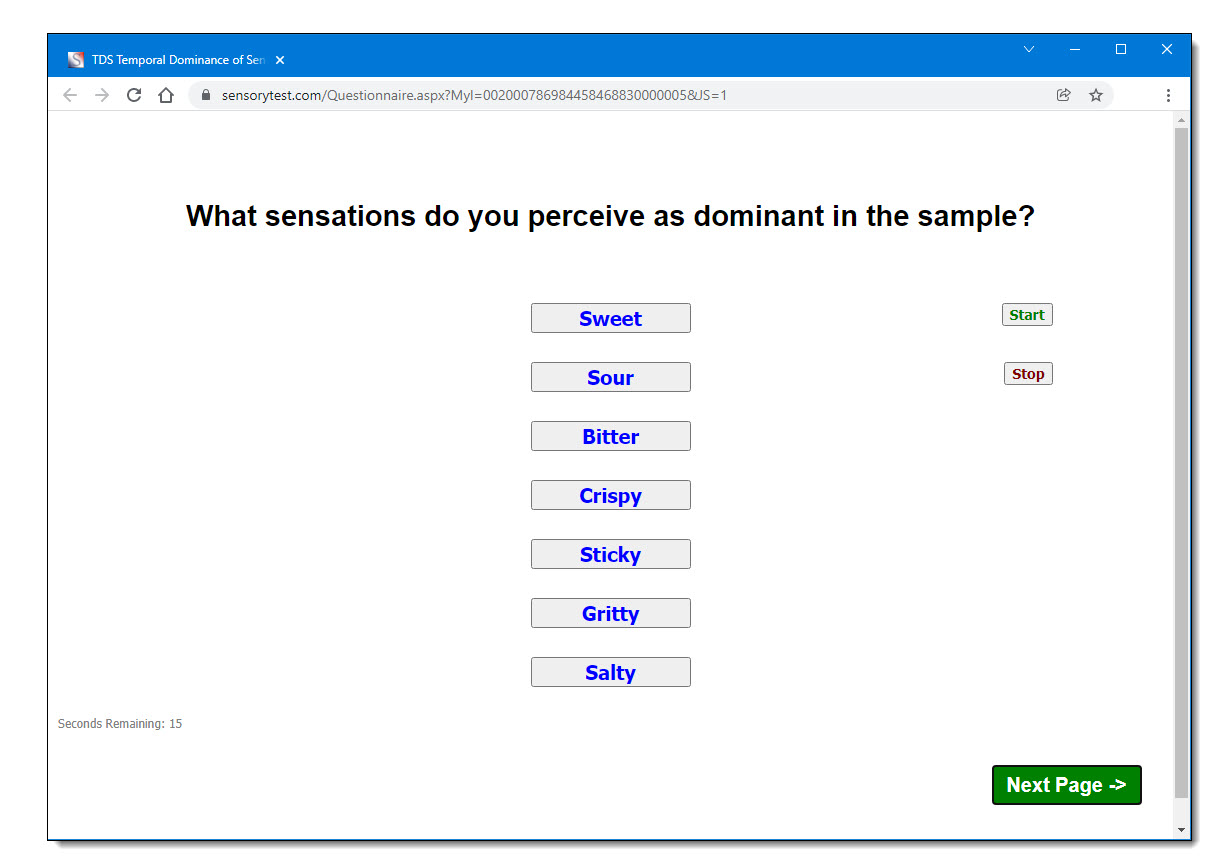
TDS Temporal Dominance of Sensations - Report Examples 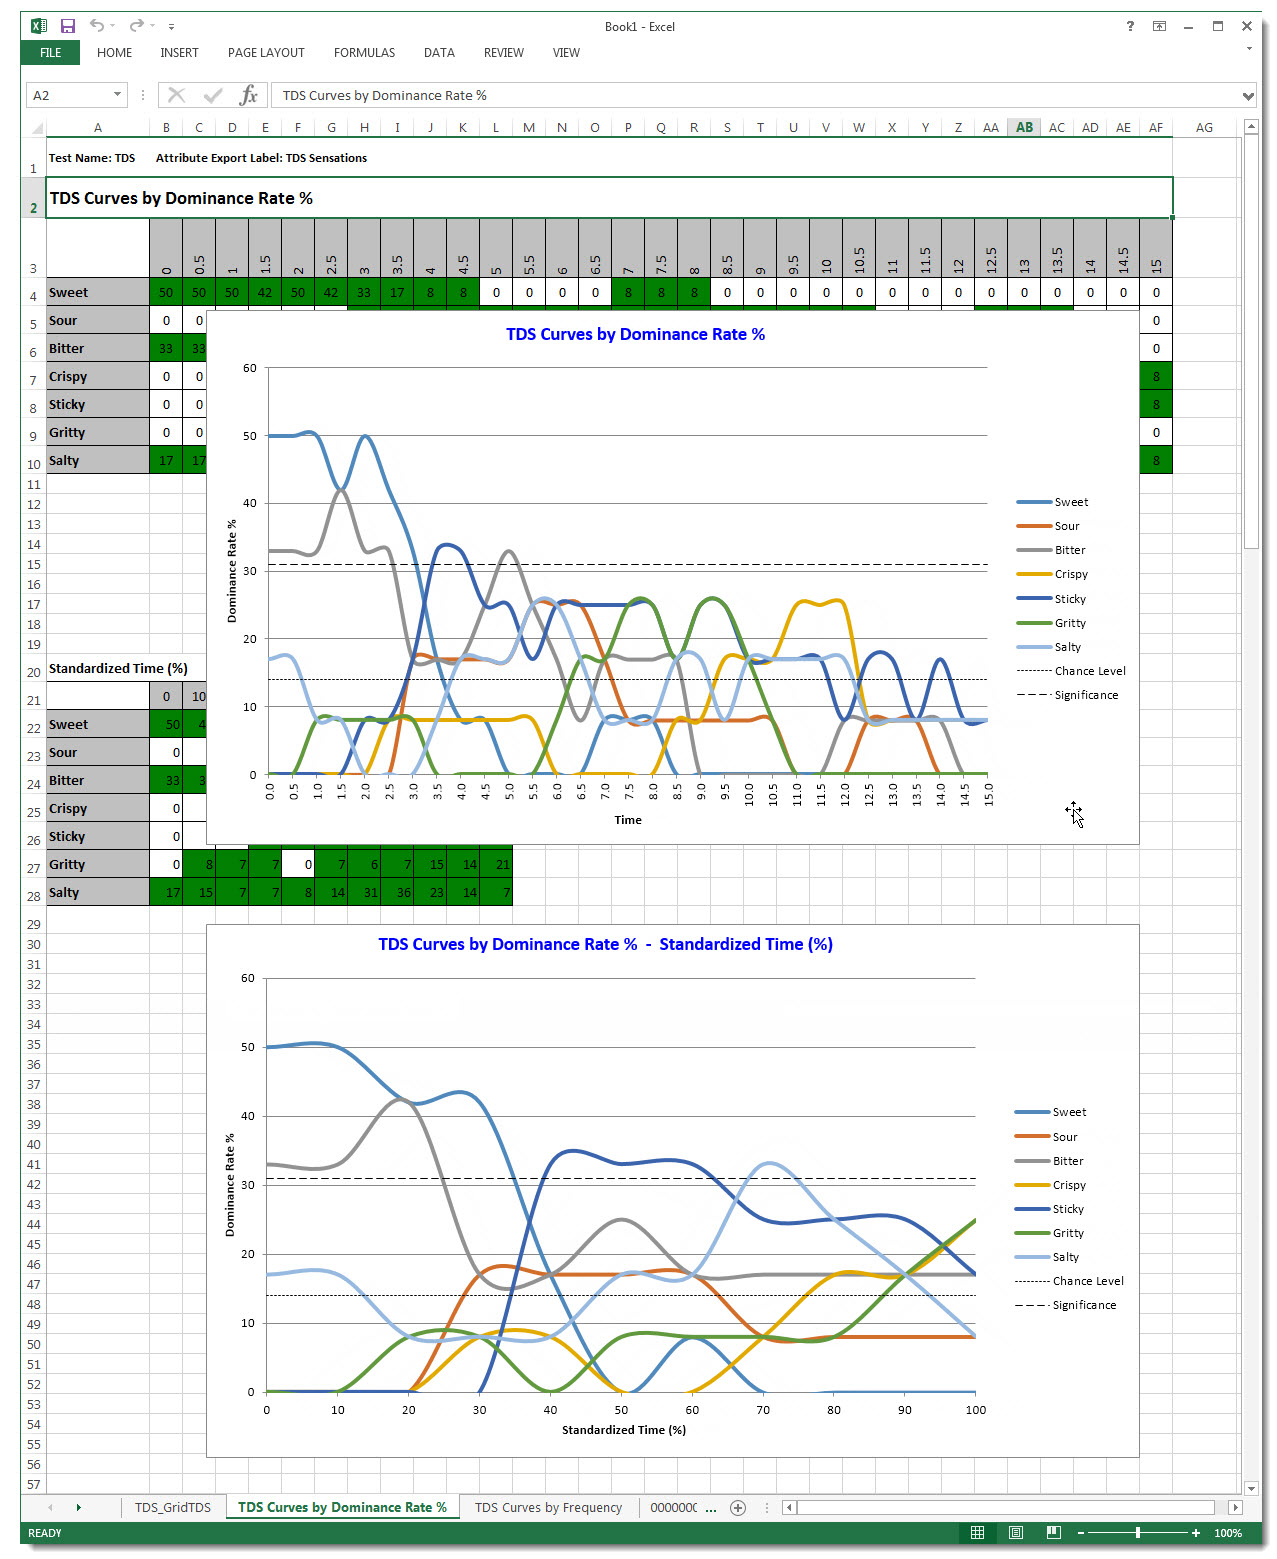
TDS Temporal Dominance of Sensations - Report Examples 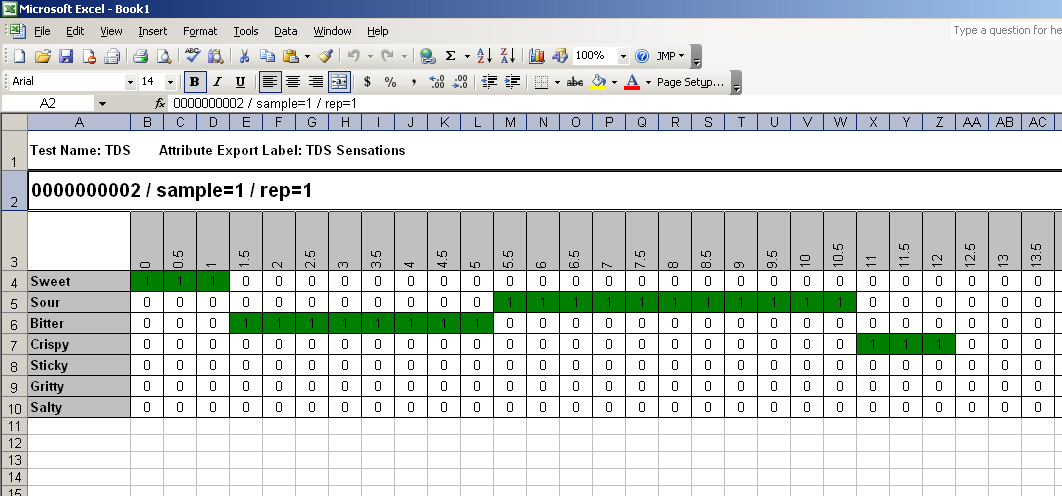
TDS Temporal Dominance of Sensations - Report Examples 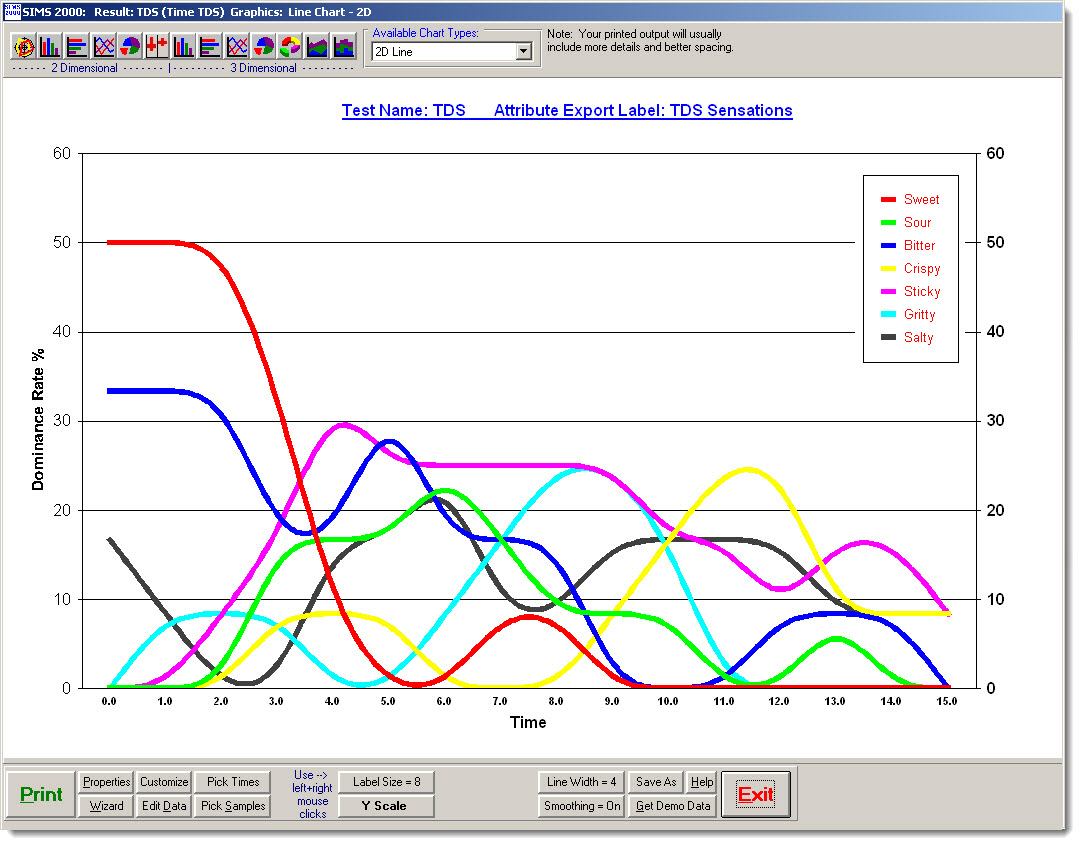
TDS Temporal Dominance of Sensations - Report Examples 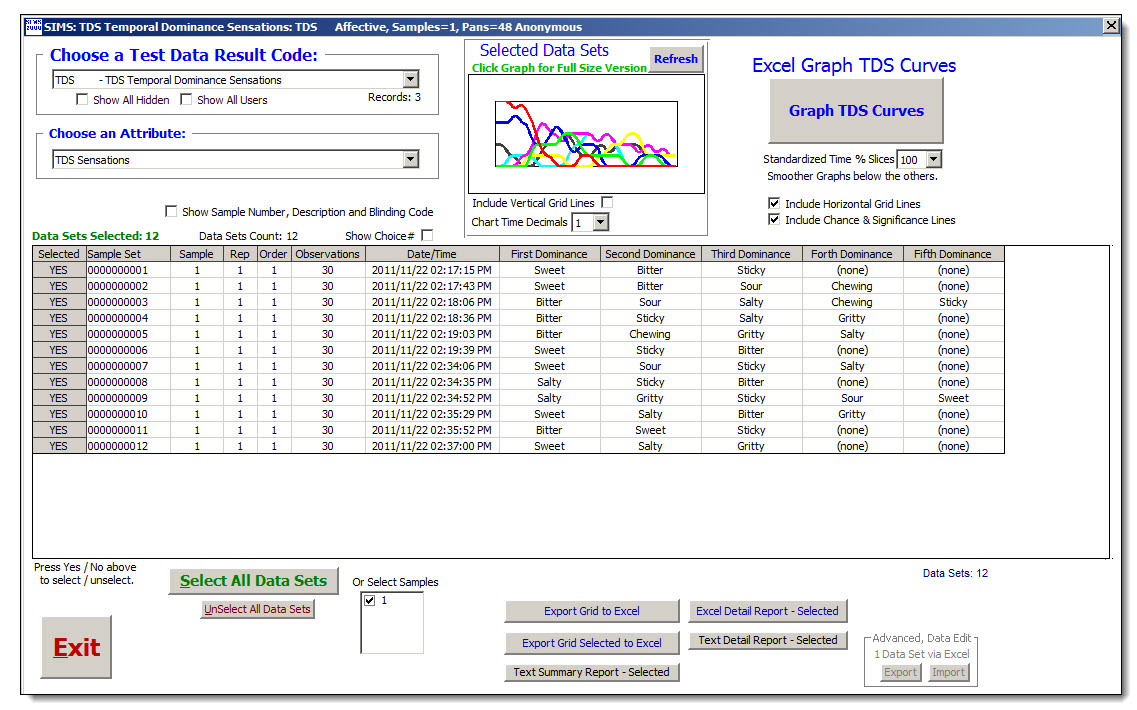
TDS Temporal Dominance of Sensations - Chance Levels and Significance Levels 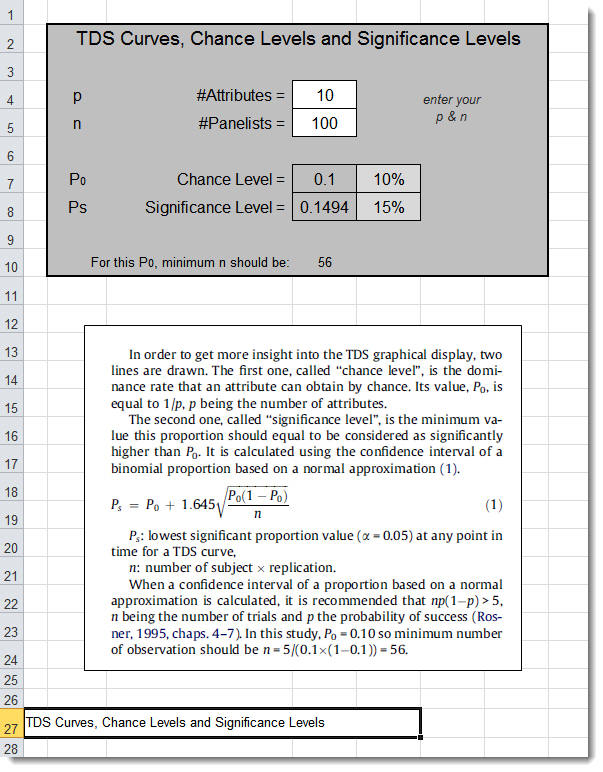
TDS Questionnaire ballot easy setup options screen: 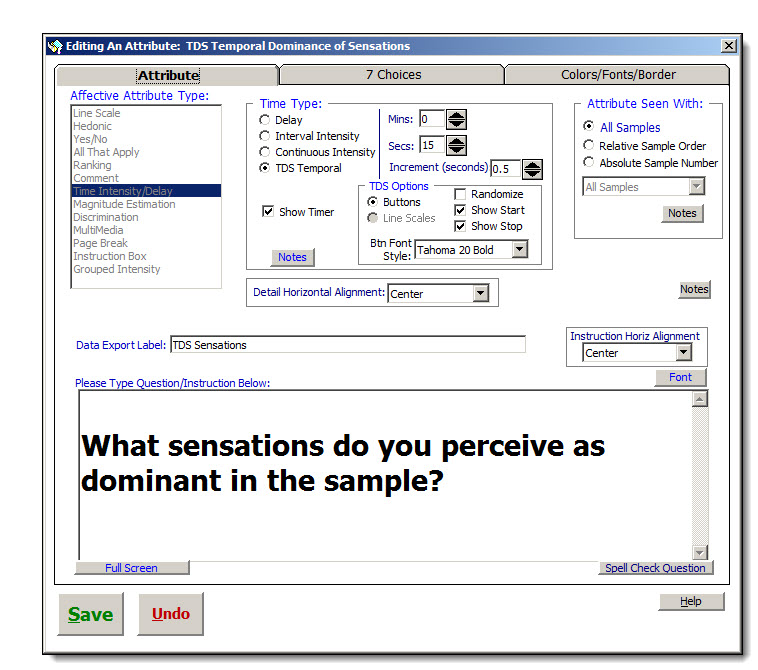
SIMS software express package file: TDS.SIMS2000ExpressPackage.sql.ZIP Example TDS Report TDS_GridTDS.xlsx |
   TDS - Temporal Dominance of Sensations
   --------------------------------------

       Temporal Dominance of Sensations is a procedure for identifying the dominant attributes from among a list
         of sensory attributes as they evolve over time.  Your test panelists record the time sequence of dominant
         attribute sensations they perceive.  Panelists begin the evaluation placing the sample in their mouth
         and by successively clicking on the attribute the perceive as dominant.

         An attribute is considered dominant until another attribute is selected.

         [Stop] button, optionally visible, the panelists can [stop] early when no attribute is perceived.

         [Start] button, optionally visible, for use when your sample time frame can begin with period of no attribute sensation.
         Recommendation:  Usually your panelists will select one of the attribute sensations to begin the clock.

         This testing method can be utilized for food samples, beverages, flavors, fragrances, and many other products.
         SIMS dynamically records the durations for each dominant attribute, data and reports are available immediately.


         SIMS dynamically records the durations for each dominant attribute, data and reports are available immediately.


         TDS Curve Graphs via Excel exporting.

           The 1st Excel graph utilizes actual TIME (seconds) on the x-axis of the graph.  Excel 'Line Smoothing' line style is displayed.
              Graphs will look smoother when you use *less* increments, example: use 1.0 second increments instead of 0.2 second increments if feasible.

           The 2nd Excel graph utilizes Standardized Time (%) TDS curves, based on each panelist's mastication period.
              Mastication period time is 0 time to end of any stimuli detection.
              Normalized for each individual panelist calculated 0 to 100% time slices of the panelist's actual mastication period as the base range.
              The detail for each panelist's Standardization Time (%) data cells could include some overlap due to ratio mathematics.
              Option:  Standardized Time Slices; you can choose the number of time slices for percentages to tabulate for the graph.
                       Select either 20 (group every 5%) or 10 (group every 10%).  Smoother graphs may be seen at 10 time slices.

              Reference for Standardization Time (%):  Nicolas Pineau, 25-01-2008, Nestle.  Temporal Dominance of Sensations (TDS): Improvements to TDS Curves

           The 3rd Excel graph utilizes Moving Average Trendlines for the TDS curves, as set by Excels Trendline feature.
               This trendline evens out fluctuations in data to show a pattern or trend more clearly.
               A moving average uses a specific number of data points (set by the Period option), averages them, and uses the average value as a point in the line.
               The x-axis lines will start at the 1st average period on the x-axis, not at point 0 on the x-axis.
               Hint:  You may want to try differing values for periods in Excel to change the smoothness appearance of the lines in Excel.
               In Excel these graphs may look better when the natural linear data is jagged and the 'Line Style Smoothing' option doesn't smooth enough.

           The 4th Excel graph utilizes Logarithmic Trendlines for the TDS curves, as set by Excels Trendline feature.
               This trendline shows a best-fit curved line, this trendline is useful when the rate of change in the data increases or decreases quickly and then levels out.
               In Excel these graphs may look better when the natural linear data is jagged and the 'Line Style Smoothing' option doesn't smooth enough.


         TDS Curve Graphs via SIMS internal graphics.

           The one graph utilizes actual TIME (seconds) on the x-axis of the graph.  'Line Smoothing' is available as an option on the graph display screen.
           Graph will look smoother when you use *less* increments, example: use 1.0 second increments instead of 0.2 second increments if feasible.
           Some additional flexible options exist.  Also review the Excel graphs discussed above.


         [  ] Include Chance & Significance Lines:
           Significance level line is the minimum value that this proportion should equal with to be considered significant (Pineau et al. 2009; Souza et al. 2013).
           Significance level is calculated using the confidence interval of a binomial proportion based on a normal approximation, according to Pineau et al. (2009).
           Significance level  = (1/A) + NORM.S.INV( C ) * SQRT( ((1/A)*(1-(1/A))) /N )      Source Tom Carr, 2014
              where  A = # attributes,  N = # of assessors  and  C = Confidence level (95%)
           Chance level line is 1/attributes.


         SIMS TDS Temporal Dominance of Sensations follows the guidelines outlined in various industry publications and articles.


       More Information on Sensory Computer Systems Website:
         https://www.SIMS2000.com/Questionnaire-Temporal-Dominance-of-Sensations.asp
